Site Links
Howdy, Stranger!
It looks like you're new here. If you want to get involved, click one of these buttons!
Quick Links
Categories
Who's Online (0)
VituixCad remedial help needed

I need remedial help because I am slow.....
So I decided to rework my Sugrivans design to try crossover changes to eliminate a small off axis bulge around 2Khz.
I think I took proper dual channel measurements with an XLR mic, jig and REW. The first problem for me in Vituixcad is
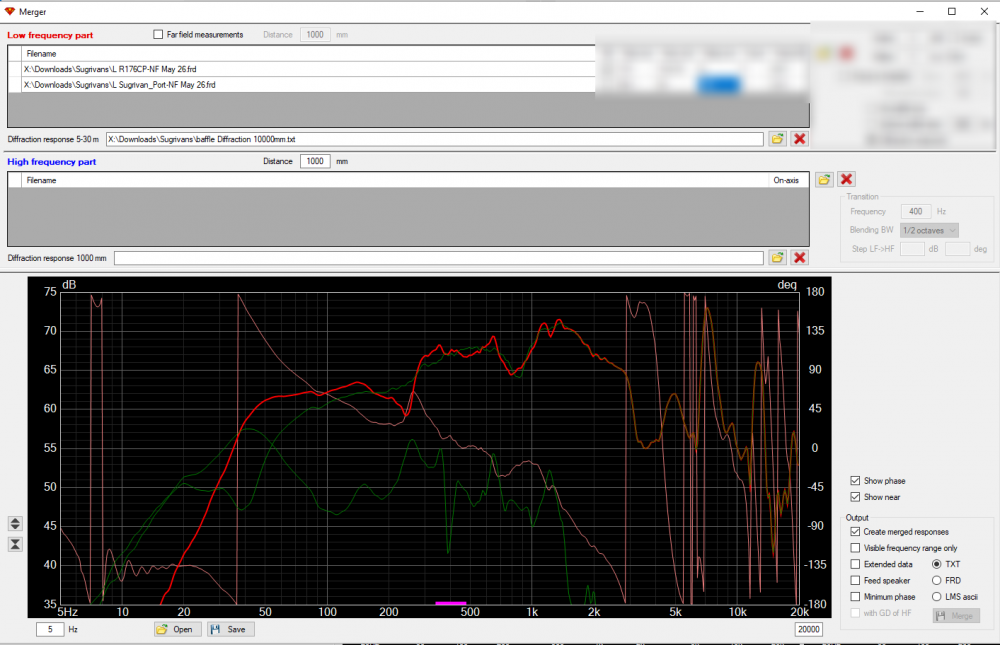
the merge dialog. I'll start off with just the near field measurements. The near field woofer and near field port measurements
show a 10 dB trough at 300Hz, and I can't seem to get rid of it. Setting a delay or using the modeled baffle diffraction just
moves the trough around a bit. Is this important?
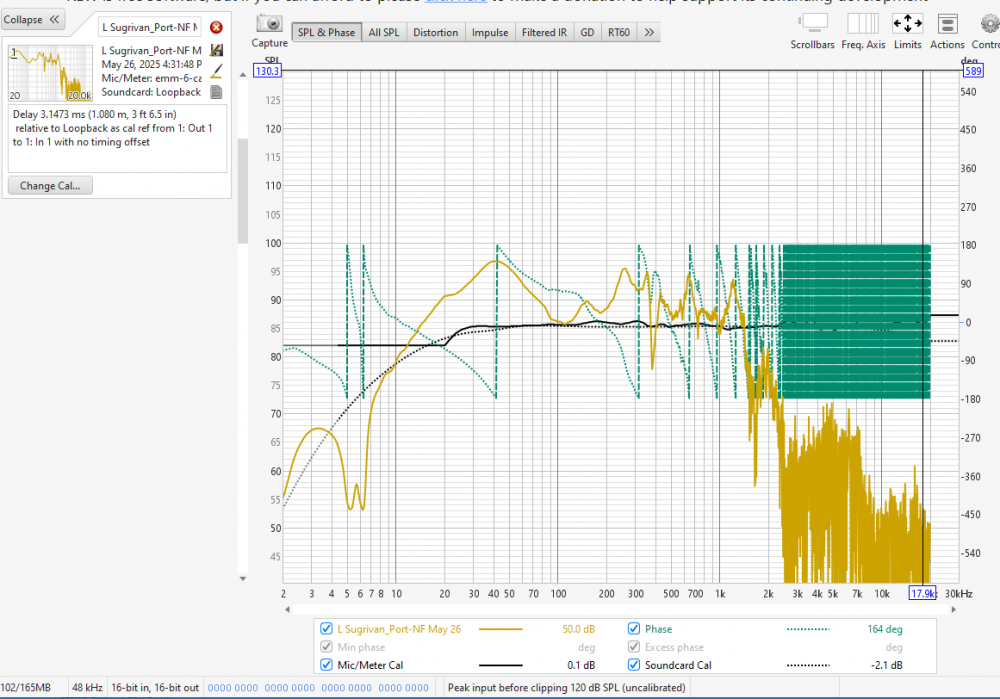
Also, I had to drop the measurement SPL for the near field, so I'm not sure that I have set the levels between the port and woofer
correctly. Is there any guidelines for this?
Comments
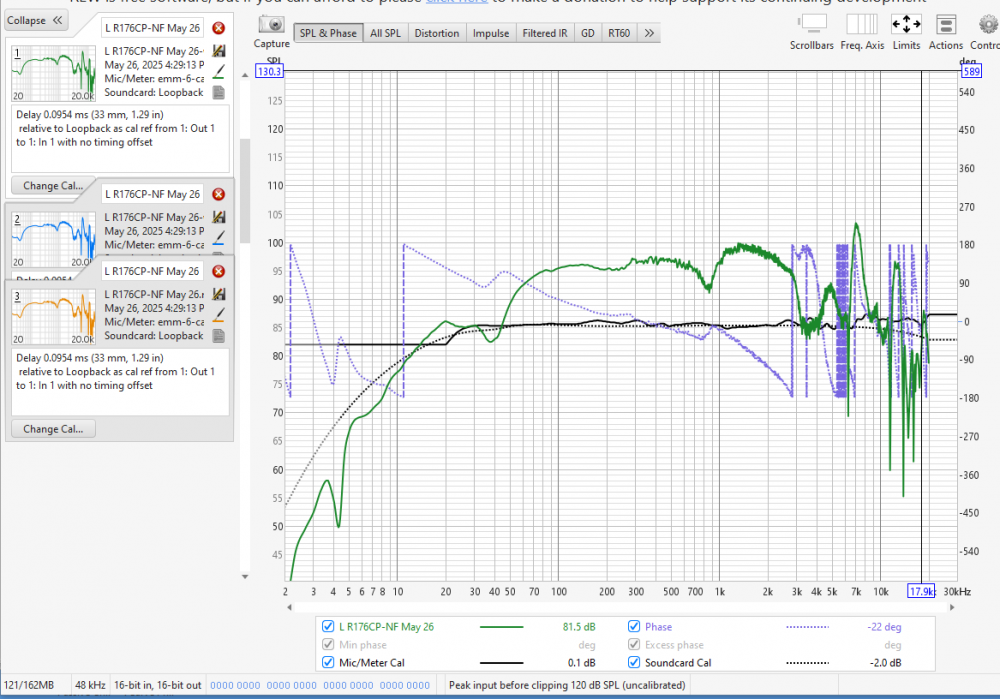
If possible, please show the VituixCAD "Convert IR to FR" screen shot as well. When you brought the two impulse files in for conversion, did you click the near field button for both IR's? Thanks.
I did not convert RE to FR in VC, because the VC Checklist "quick start" said that it was not needed for REW 5.20 and higher. I used REW 5.31.3.
But I can easily do that if best practice.
The raw measurements (smoothed) in REW look approximately correct.
My guess is that your summation is probably correct. Looks like you have a bad port resonance in the 200 to 400Hz range that is messing up the summation. Probably the longest dimension of your TL reflecting back out the port terminus. Merge your NF+FF+diff model by adjusting levels and eye balling it the best you can and then export.
First, I want to point out that your port output matches your Hornresp sim and Omnimic mesurements in your original build thread quite well. I think you are correct that the SPL measurements in REW seem fine.
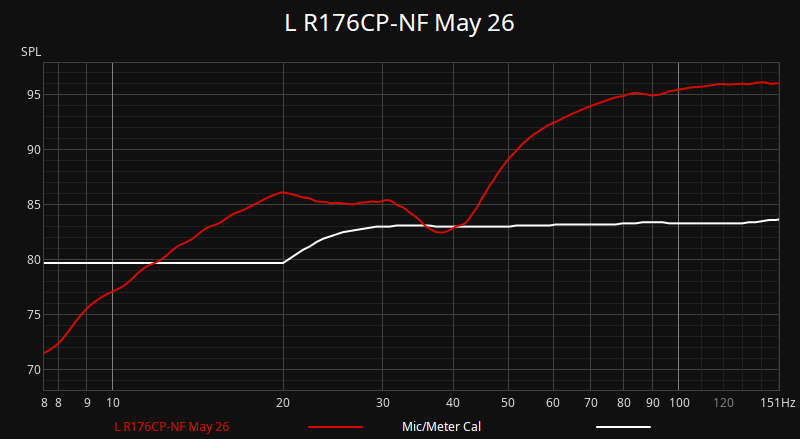
I don't have an answer, but coincidentally I had a problem recently that may help. This is from a build I took to InDIYana earlier this month. The first image below is the nearfield of the woofer (Cyan), nearfield port (yellow) and VituixCADs attempt to combine them in red. I have to assume this is a phase error in my measurement.
The image below that one is after taking different measurements. The reason I don't have an actual answer for you is that I don't remember what I did back then to fix it. I remember being quite frustrated trying to figure it out for a couple of days, trying to generate "minimum phase" files which didn't work, etc.
One thing I do notice in your post is that I see the "Show phase" radio button selected in the VC merger tool window but I don't see any phase. So it is possible that it is a phase issue. I would suggest going back and retaking the measurements in REW and keep track of ALL the settings. If the issues isn't resolve, post the settings and maybe we'll spot something that could be the culprit. Of course, your merged results up to 250Hz look pretty normal, so there is a good chance Bill is right, that your merged results are simply correct.
I had similar problems to David's first example when summing NF cone and NF port data a few years ago when I still used OmniMic. I think the fact that OmniMic's phase begins at the peak of the impulse was causing the problem. Since switching to dual channel and using VituixCAD's "Convert IR to FR" tool to process the files, I seem to generally get good looking summations. As David suggested, you should be showing phase data on the merger screen when the phase button is selected. You could also try opening your FRD files using notepad to see if you have missing or zero phase data in the file.
Measurement without a timing reference will always be problematic for combining multiple measurements, whether from multiple drivers or from nearfield driver and port terminus. Mininum phase is not the way.
TL terminus magnitude at 270Hz is nearly the same level as it is at 40Hz. Compare phase of your measurements and the answer should be "what did you expect?". That magical TL sound comes through") . Notepad? Load in calculator tool for data viewing, compare with "save as overlay" feature. View of phase in merger tool will not show each nearfield response individually, it is for viewing of far field (high frequency part) to confirm correct delay of low frequency part for proper merge.
. Notepad? Load in calculator tool for data viewing, compare with "save as overlay" feature. View of phase in merger tool will not show each nearfield response individually, it is for viewing of far field (high frequency part) to confirm correct delay of low frequency part for proper merge.
Merging nearfield even with timing reference still has some struggles, as the mic is physically in a different location for each measurement. At very low frequency (ie. normal port output without high frequency reflection/contamination), this error in distance is inconsequential, however as frequency increases the error in distance can create some error in what the actual combined response at listening distance would be.
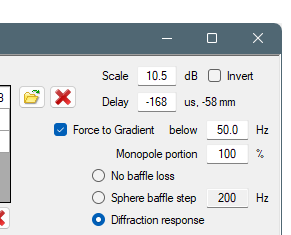
To combat this error, since version 2.1.112.0 VituixCAD has included an additional "Delay mm" field for each low frequency measurement. Delay entered here should be the travel distance difference between the main cone/radiator and port terminus at typical listening distance of 2-4m on-axis. This is to help with response accuracy when the port exit is not on the front baffle in line with the driver.
The original near field measurements DID include phase, I just forgot to check the box in REW when I did the screen cap.
Do I need to run these through IR to FIR? They seem to be FRD files packaged in a MDAT container.
https://kimmosaunisto.net/Software/VituixCAD/VituixCAD_Measurement_REW.pdf
I haven't done IR to FIR since I stopped using ARTA a few years ago. Just go to FILE\EXPORT\ALL MEASUREMENTS in REW and export them to .frd files, which will include the phase. The REW guide that dcibel posted has a screenshot for the recommended settings (e.g., smoothing, PPO (pixels per octave), etc.)
I have a feeling it is not the phase problem that I ran into, since things look normal up until 250Hz, but it will be good to rule it out. Once we know, we can move onto the merge process and see what that gets us. (As a side note, even though I never figured out what went wrong with my bad measurements, my mic did malfunction within a few days later and is at the MFG being repaired.)
Yep. That is what I followed.
I uploaded the near field woofer and port measurements to Google Drive. The "raw" (.FRD) measurement is what I loaded into VC, I'm pretty sure that it has phase. Not sure why I need the .mdat files from REW
https://drive.google.com/drive/folders/13D887oc5H3DFdGRoeWL2Db7t7sXjzmah?usp=sharing
Once you have the exported frd files in VituixCad you don't "need" the .mdat files anymore for your xo design. But they have a lot more information than the stripped down frd files. For example... They have the impulse response data and you could go back and change the gating. They have distortion information. etc. So, they "could" contain valuable info. On the other hand, I typically save the mdat file and once all the measurements are good and loaded into VituixCad I don't normally use it anymore.
There's nothing wrong with the measured data. Did what I post above regarding added delay required for rear port exit go over your head? You may consider as well that if you capture good enough far field data to merge <250Hz, the nearfield combined response problem >250hz will simply go away with the merge.
Only concern you might have with low frequency measurement is that your EMM-6 mic cal ends at 20Hz, it looks like it was headed for a steep slope but flatlines due to lacking data, this creates some error in SPL for any measurement <20Hz. You might consider processing the mic cal to extend the slope of the mic rolloff below 20Hz if you care about that, but honestly the low end response <30Hz looks more "correct" without the cal file, meaning that low end rolloff in the mic cal is likely in error, typical for EMM-6 to have poor calibration.
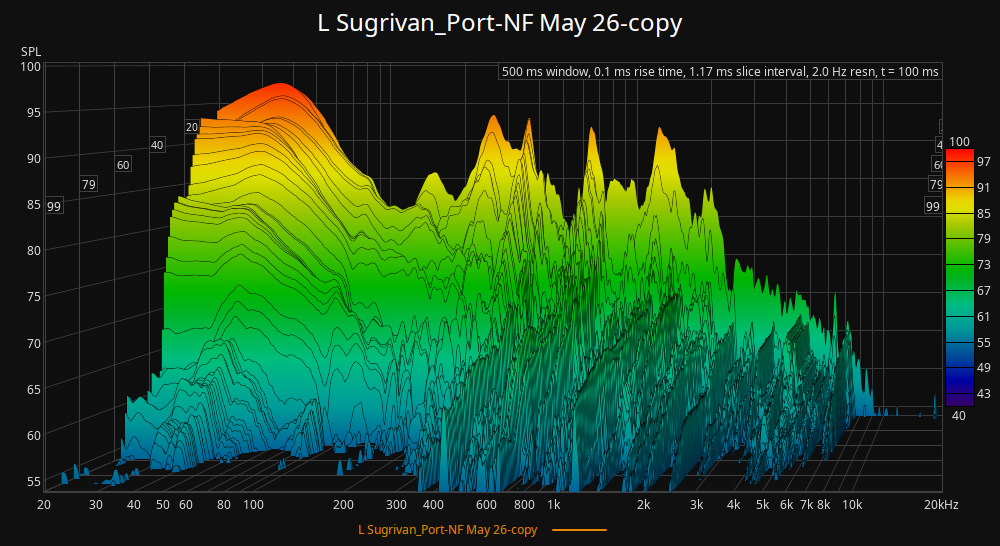
The MDAT is the "raw" file, the FRD is the processed and exported snapshot. MDAT contains much much more information, the raw impulse, the mic cal, the loopback measurement, the entire recorded audio. If there is ever a need to review, troubleshoot, or re-process a measurement, the MDAT is the important bit. Can't make fun waterfall graphs of your TL resonant modes with just a basic FRD")
I can't speak for rjj45, but it went over my head. And it's likely related to the issue I ran into and posted about above. My speaker is a horizontal studio monitor with the port on the SIDE of the speaker. I was thinking I understood... mm from cone to port makes sense to me... but how does that change at the listening distance 2m to 4m away? I'm assuming (??) it is a translation to ms (since it is delay) not sure how to implement what you are saying. In my case the woofer is on the left side of the front baffle, center is 5 inches from the left edge, and the port is 7 inches back on the left side.)
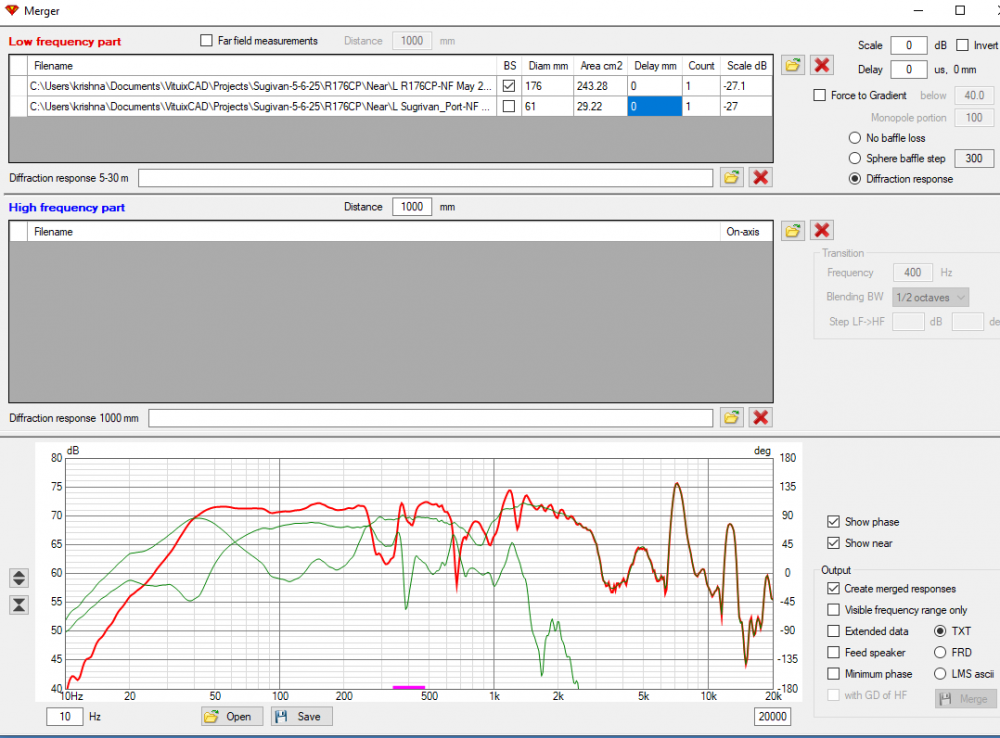
Don, I downloaded your two FRD's and loaded them into Vcad's merger tool. I get an identical wonky summation when using the same delay and scaling that you used. The only difference is that when I check the "show phase" button, the phase actually shows up on my screen. I'm using Vcad version 2.0.123.0.
The purpose of the merge process is to produce a single response representative of the far field response at real listening distance. When processing multiple low frequency measurements, the assumption is made that the measurements occur in the same location in space, ie same distance to listener. Reality of combination of a nearfield woofer measurement and nearfield of a port on the rear of the cabinet, is that there is physical distance between those measurements not being accounted for. At very low frequency, the phase error that results is of no importance, too small to matter, but at 200-500Hz, it can be significant, especially for larger speakers. In Don's case it can make a significant difference to how all that TL resonant stuff gets added together as a result of the phase angle of each response. So the option is there to apply a delay value to the port measurement to align it properly. For your speaker with the port at the side, I would simply measure from the centre of the port to the front of the baffle and start there for a delay value.
In your post above, it looks like the top image has the port response completely out of phase. It's not clear to me what you've done from your post, but you said "minimum phase" in there somewhere, which will always be somewhat off, even when you invert the phase of the port response (required if min phase was used). For some people it may be "good enough", and more so for a port response that's fairly clean like you show. Min phase is not the way if you seek perfection.
Re: delay - I understand why that can be important, and I do a similar "manual fixup" to Hornresp simulations.
OK, looked in the big VC help manual - now I sort of understand it.
But In the Help file example, what does this mean?
Delay is - 168 microseconds or minus 58 millimeters?
Yes, the image where the port response seemed completely out of phase really threw me off. I knew "something" was wrong and recognized it as a phase issue. I tried using minimum phase data but it did NOT fix the issue. I never figured it out, I just took new measurements.
Don, can you post your baffle dimensions and the woofer placement from the top or bottom?
That delay is the adjustment provided to the low frequency measurements to align the phase with high frequency (far field) portion. It will auto update every-time you click on the graph on the bottom to select the merge frequency. I don't suggest changing it, and it's specific value is relatively unimportant. If you fail to click on the bottom graph to select merge frequency, you will have problems though, delay value will not be calculated which may result in a bad phase result, let a lone default 400Hz merge frequency may not be ideal either.
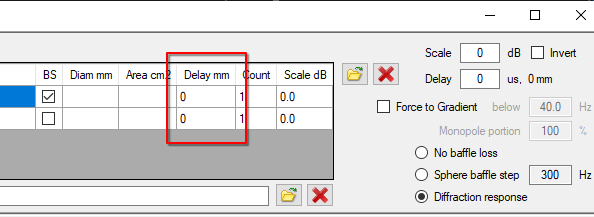
The delay value I was referring to is the delay mm column for each individual measurement, so they can be adjusted in relation to each other.
Don has a drawing on the other thread, which shows the cabinet depth at 10.25 inches, port on the back side slightly below the woofer level. So 260mm might be a good guess. But would this be entered as +260mm or -260mm. It makes quite a difference in the summation.
I was referring to front baffle and woofer placement to model diffraction at 1m and 10m. I'm hoping we go through the whole merger process in this thread, as I think that might be useful for people to see.
Delay is is always the same direction in all locations in VituixCAD, and following the meaning of "delay", so positive delay means further from the listener, and negative delay is closer to listener. You can put positive delay on the port measurement, or negative delay on the woofer cone measurement, it doesn't matter. Once you select merge frequency, overall low frequency delay will be sorted to match high frequency portion.
Baffle: 11W x 18H Woofer center 5 inches from bottom
FWIW, the slot port TL exit is 5.5 inches down from the top on the back.
Cabinet depth is 10.25 inches INTERNAL, 12 inches EXTERNAL
Great looking speaker Don!
Thanks man!
Don,
Question regarding your screenshot from VCAD merger tool in post #1...can you confirm the area of the driver and slot port? I Googled the Rival driver and found an Sd of 131cm2 but you have 243.28cm2 (red circle below). Also, the area of the slot port...I tried to tell from your drawings and it looked like 3.01cm x 20cm but it was hard to tell. This would be 60cm2 but you have 29.22cm2 (green circle below).
Good catch! Another dumbo error.
The Rival R176 is listed as 132 cm^2 Sd.
The slot port area is about 1x9.5" = 61.3 cm^2 (not diameter, idiot)
Now you have to make the combined low frequency response yourself